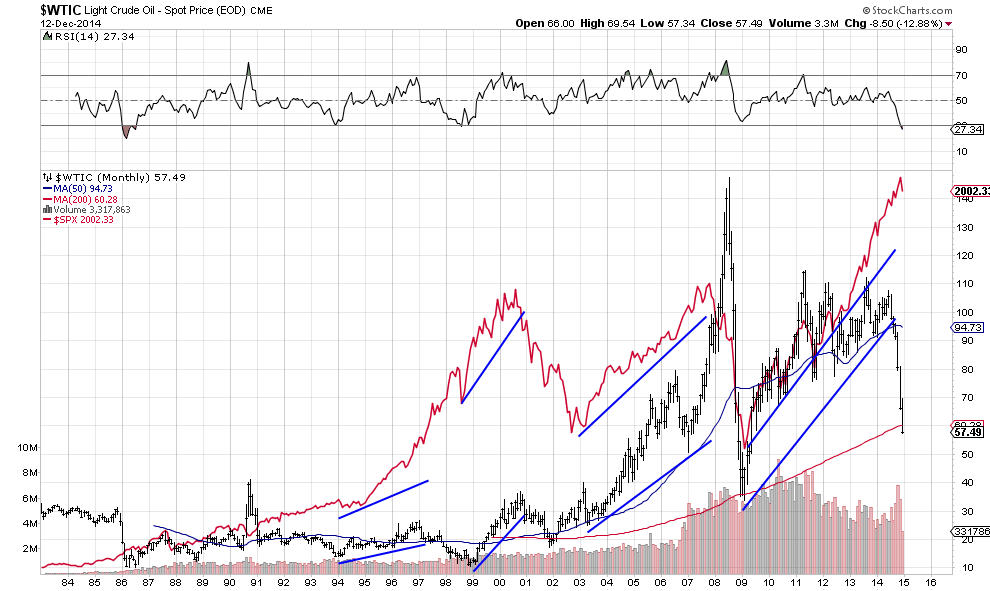
I have been monitoring the collapse of the price of oil the past few months, but I did not fully appreciate the magnitude of the decline until I constructed the monthly chart above so I could compare this decline to previous declines over the course of the past 30 years. I added the S&P 500 to the chart to show the divergence that has occurred between oil and equities in the past several months. As the chart illustrates, we haven’t seen oil and equities diverge in such a pronounced fashion in the last 30 years. The vast majority of the time during the last 30 equities and oil have basically moved in the same direction and it is usually with equities leading the moves up and down. Interestingly, oil and equities started to diverge in a pronounced way back in 2012, when the S&P made a higher high, but oil failed to do so. The spread continued to widen as the QE fueled stock market continued to ascend and the oil market, while taking wide swings, basically went sideways until the totally breaking down in the 2nd half of 2014.
Now, the big question is how long it will be before oil and equities resume the traditional trading relationship they had and which market will “correct” to a greater degree in order to come into an alignment that has more closely resembles the relationship that has been common during the past several decades. Will equities experience a massive sell off? Will oil bottom out soon and proceed to rally?
Or will we see something completely different this time, with oil and equities trading in a more independent fashion for an extended period of several more months or longer? I don’t think the answer is an easy one due to the complexity of the current oil market and the unprecedented circumstances influencing prices. With few exceptions oil has followed equities during the past several decades and that was certainly the case during the last major crash in oil, which followed the great stock market crash of 2008-2009. This time things are very different.
In the past OPEC, led by Saudi Arabia, was able to boost oil prices simply by cutting production, but pressure by US based Shale producers have significantly reduced the ability to control the market. It appears that SA is now attempting to lower prices to a level that are unprofitable for Shale producers. But it also appears that the Saudi’s likely have geopolitical reasons for engineering this decline in the price of oil and that may in fact be the more important reason to them. Sub $60.00 oil certainly hurts the Shale producers, but it also really hurts the finances of Russia and Iran, two strategic foes.
How low will oil go? Good question. I’m not sure where exactly the bottom will be, but I think it is a fairly good bet that oil will stage a fairly significant rally once it consolidates when this sharp sell-off finally runs out of steam. However, barring another war in the Mideast that takes a LOT of supply offline I think it will probably be a long time until we see sustained $100 plus per barrel oil, because the technology to extract Shale oil isn’t going away, it will only get better in the future.
