Looks like the latest Stock rally is finally running out is steam, but the market has demonstrated surprising strength over the past several weeks. However, it will be very interesting to see if the stock market can maintain upward momentum as the price of oil declines and appears poised to make a deeper correction.
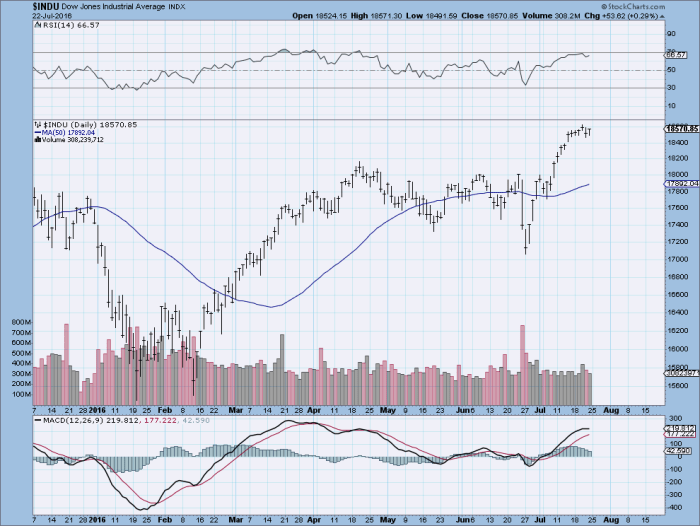
Top chart: DJIA daily.
Lower chart: WTIC (black) vs DJIA (red)